Debug like a pro! Memory Dumps with WinDbg
September 30, 2010 Category: Blog
Recently I was working with a client to debug an issue that they could only reproduce in production (I hate those). Unfortunately, this was the sort of error that was sporadic and unpredictable – so hooking up a debugger and waiting wasn’t much of an option. Fortunately, Microsoft’s Debug Diagnostic Tool can be used to automatically grab an IIS Memory Dump during certain scenarios (like crashes and hangs). Normally, memory dumps aren’t the kind of things that .NET developers go digging in to. Well never fear my .NET developer friend, let Tess from the Microsoft debugging team show you the way!
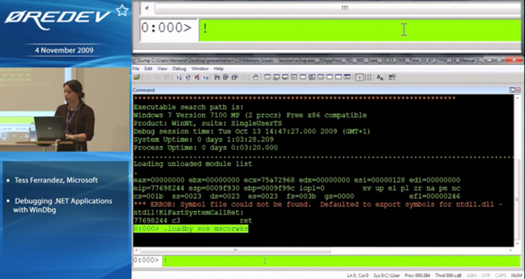
This is a great presentation that Tess Ferrandez gave at 0reDev last year on Debugging .NET Applications with WinDbg. After you’ve watched her presentation be sure to check out the rest of her full blog, especially her post on using CMDTree then go read John Robbin’s post on Debugger Markup Language (DML).
Now you are well on your way to being the Memory Dump Ninja that I always knew you were!
